

Symbol overview
The Overview is the summary sheet of each instrument: the starting point to frame a symbol at a glance before moving to deeper analysis.
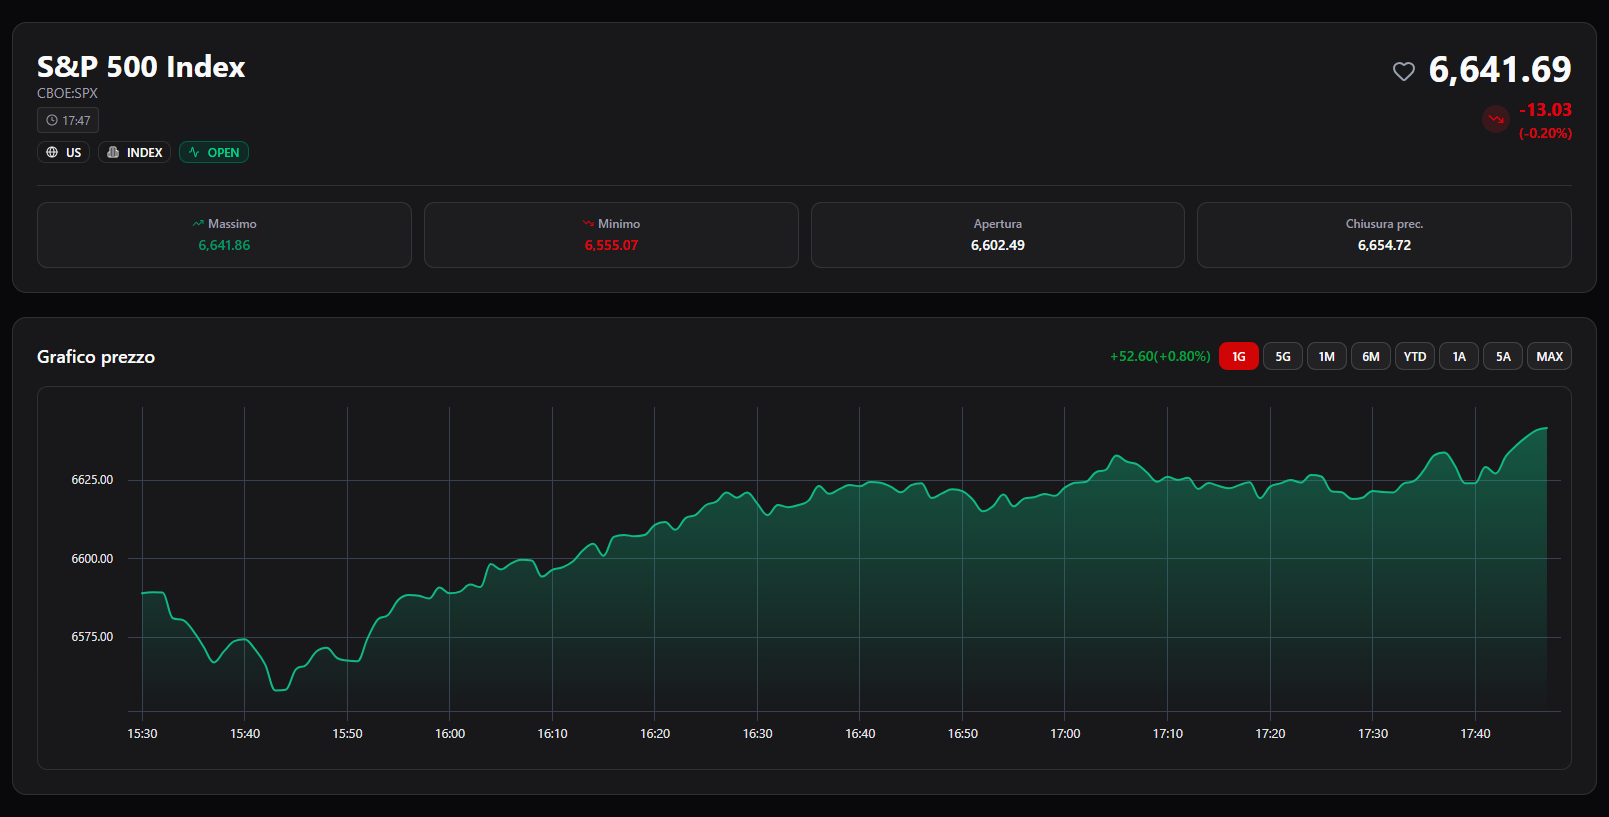
The symbol overview: header with price and change, session data, and the historical chart.
The header
Section titled “The header”At the top you find the name and code of the instrument, the current price with the absolute and percentage change of the day, and badges describing its nature (country, currency, type — index, stock, ETF, futures) plus the market status (open, pre-market, post-market, or closed).
The heart icon adds or removes the instrument from your favorites.
Session data
Section titled “Session data”The cards under the header summarize the key numbers of the day: Open, High, Low, and Previous Close.
The price chart
Section titled “The price chart”The price chart shows the behavior of the instrument. With the timeframe buttons you switch from an intraday view to a long-period one: 1D, 5D, 1M, 6M, YTD, 1Y, 5Y, MAX. It is the fastest way to understand whether today’s move matters in the bigger picture.
Other information
Section titled “Other information”Depending on the instrument, the overview also includes:
- quote details (previous close, volume, and more)
- market open/close times
- historical records (all-time high and low with dates)
- available option expirations, with a shortcut to the series on the Options Chain
How to use it
Section titled “How to use it”Open the Overview whenever you want a quick read of an instrument: price, change, and historical context in one screen. From here, using the side menu, you can move to the Options Chain or the Intraday and Position analyses.
Related pages
Section titled “Related pages”Ready to use Gaudio OTT?
Section titled “Ready to use Gaudio OTT?”Open your free account and put what you just read into practice.