Intraday volumes
The Intraday volumes chart (in Intraday analysis) shows, strike by strike, the volume of options traded during the day, separating calls and puts. Unlike Open Interest (open contracts), volume tells you about today’s activity: where trading is concentrating in real time.
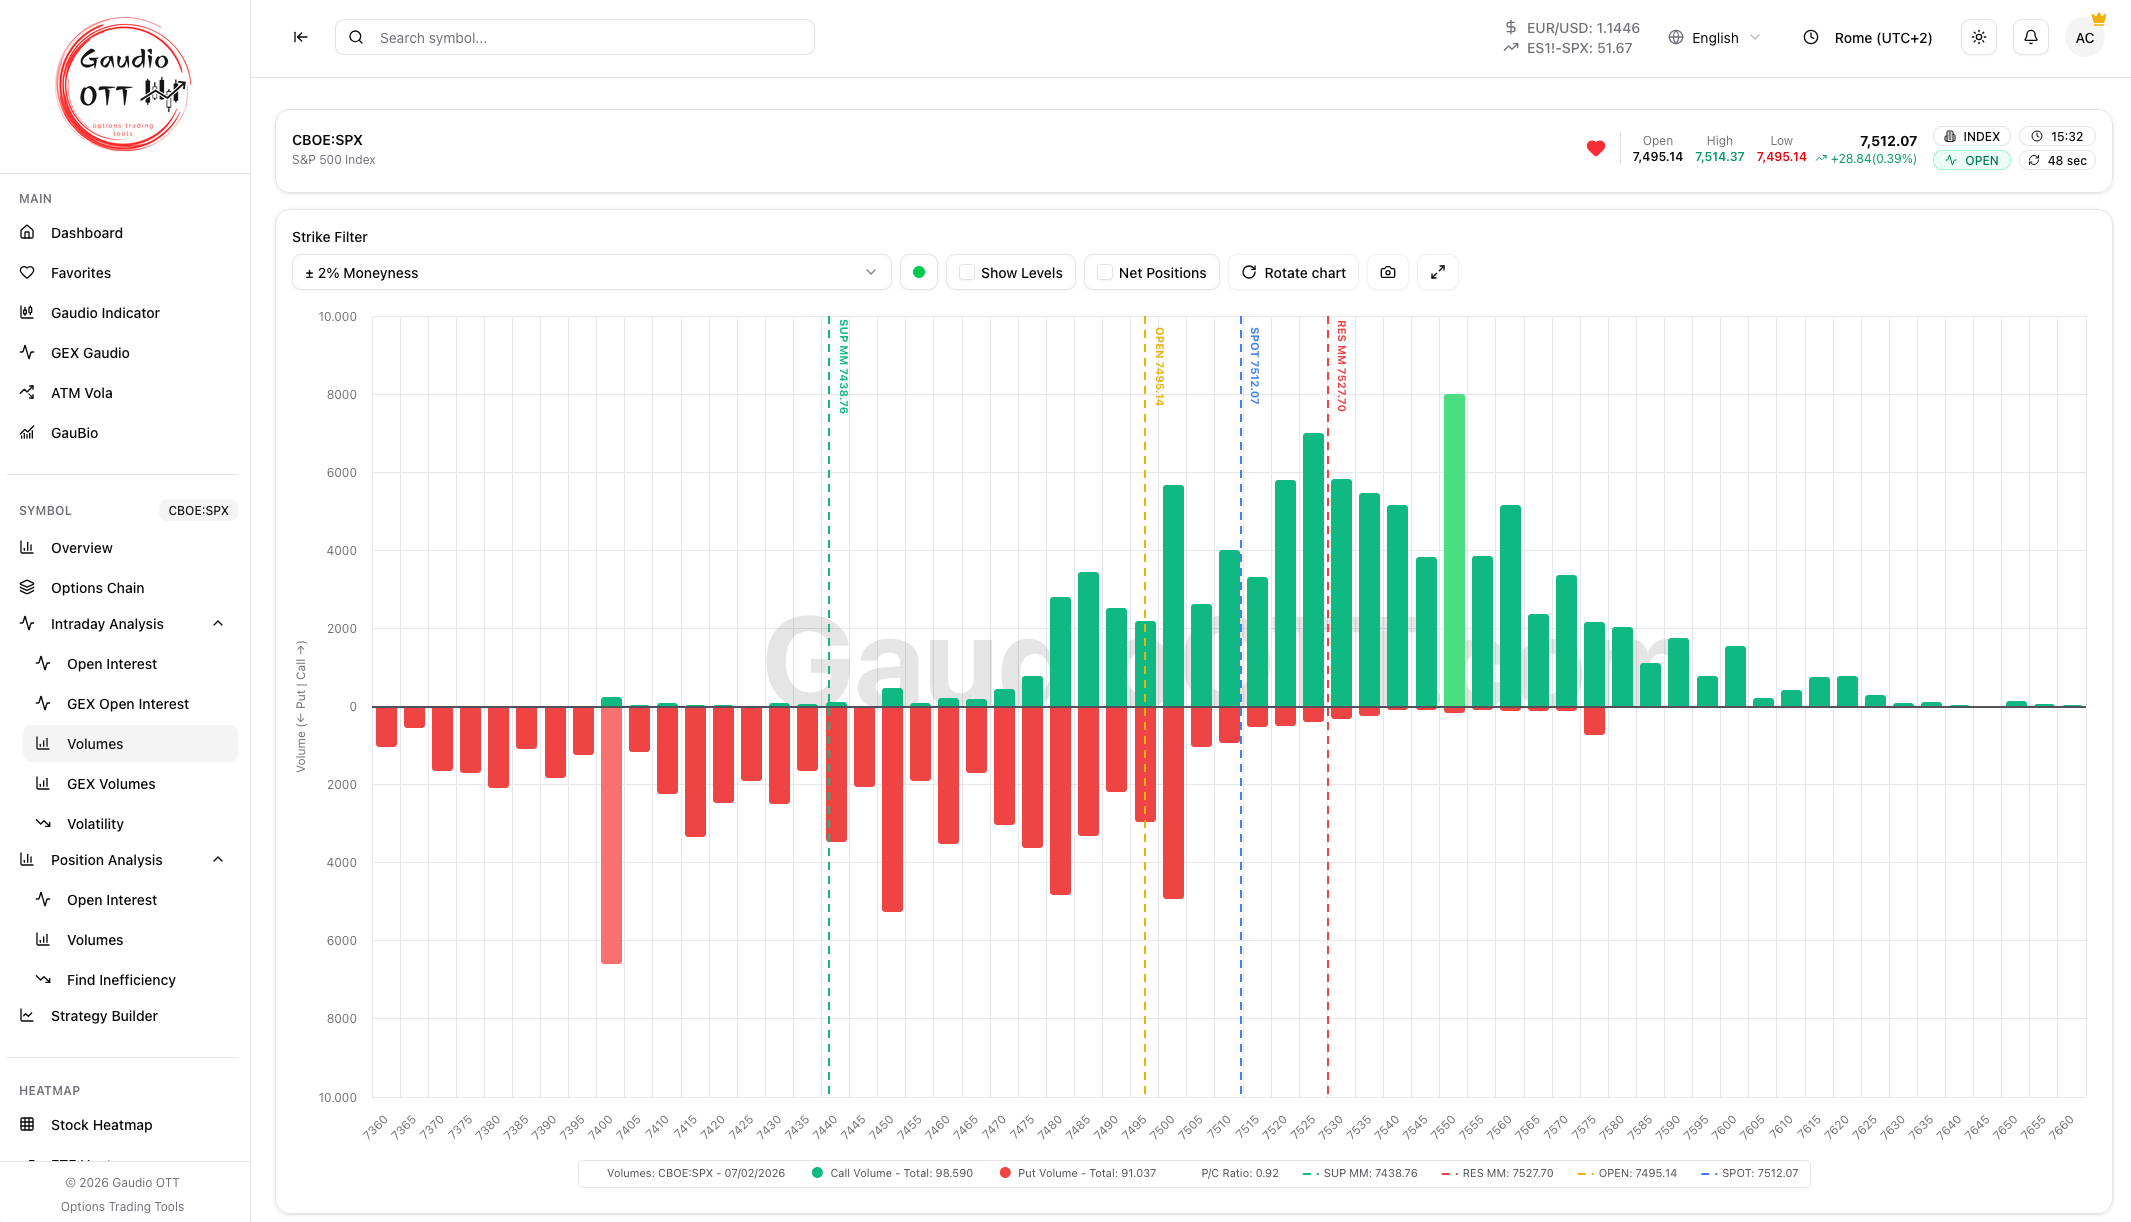
Volumes by strike: the day’s trading activity, with the current price highlighted.
How to read it
Section titled “How to read it”- Each bar is a strike; its height shows the traded volume.
- The color separates calls and puts.
- The vertical dashed line marks the current price (spot).
- The summary at the bottom shows totals and the Put/Call ratio of volumes.
Controls
Section titled “Controls”- Strike filter (Moneyness) — limits the view to strikes within a chosen distance from the price (for example ±5%), so attention is not spread over far strikes.
- Show Levels — highlights the most significant levels.
- Net positions — shows the net balance instead of the separate values.
- Rotate chart — switches the orientation of the bars.
- Screenshot and Fullscreen — save an image or view the chart full screen.
Open Interest or volumes?
Section titled “Open Interest or volumes?”The two charts complete each other: Open Interest shows where positions are already open, volumes show where trading is happening now. A sudden concentration of volume on a strike can precede a change in Open Interest in the following days.
Related pages
Section titled “Related pages”Ready to use Gaudio OTT?
Section titled “Ready to use Gaudio OTT?”Open your free account and put what you just read into practice.