

Volatility chart
In the Volatility section (inside Intraday analysis) you follow how implied volatility evolves for a specific underlying and expiration, and you can monitor several volatility skews at the same time.
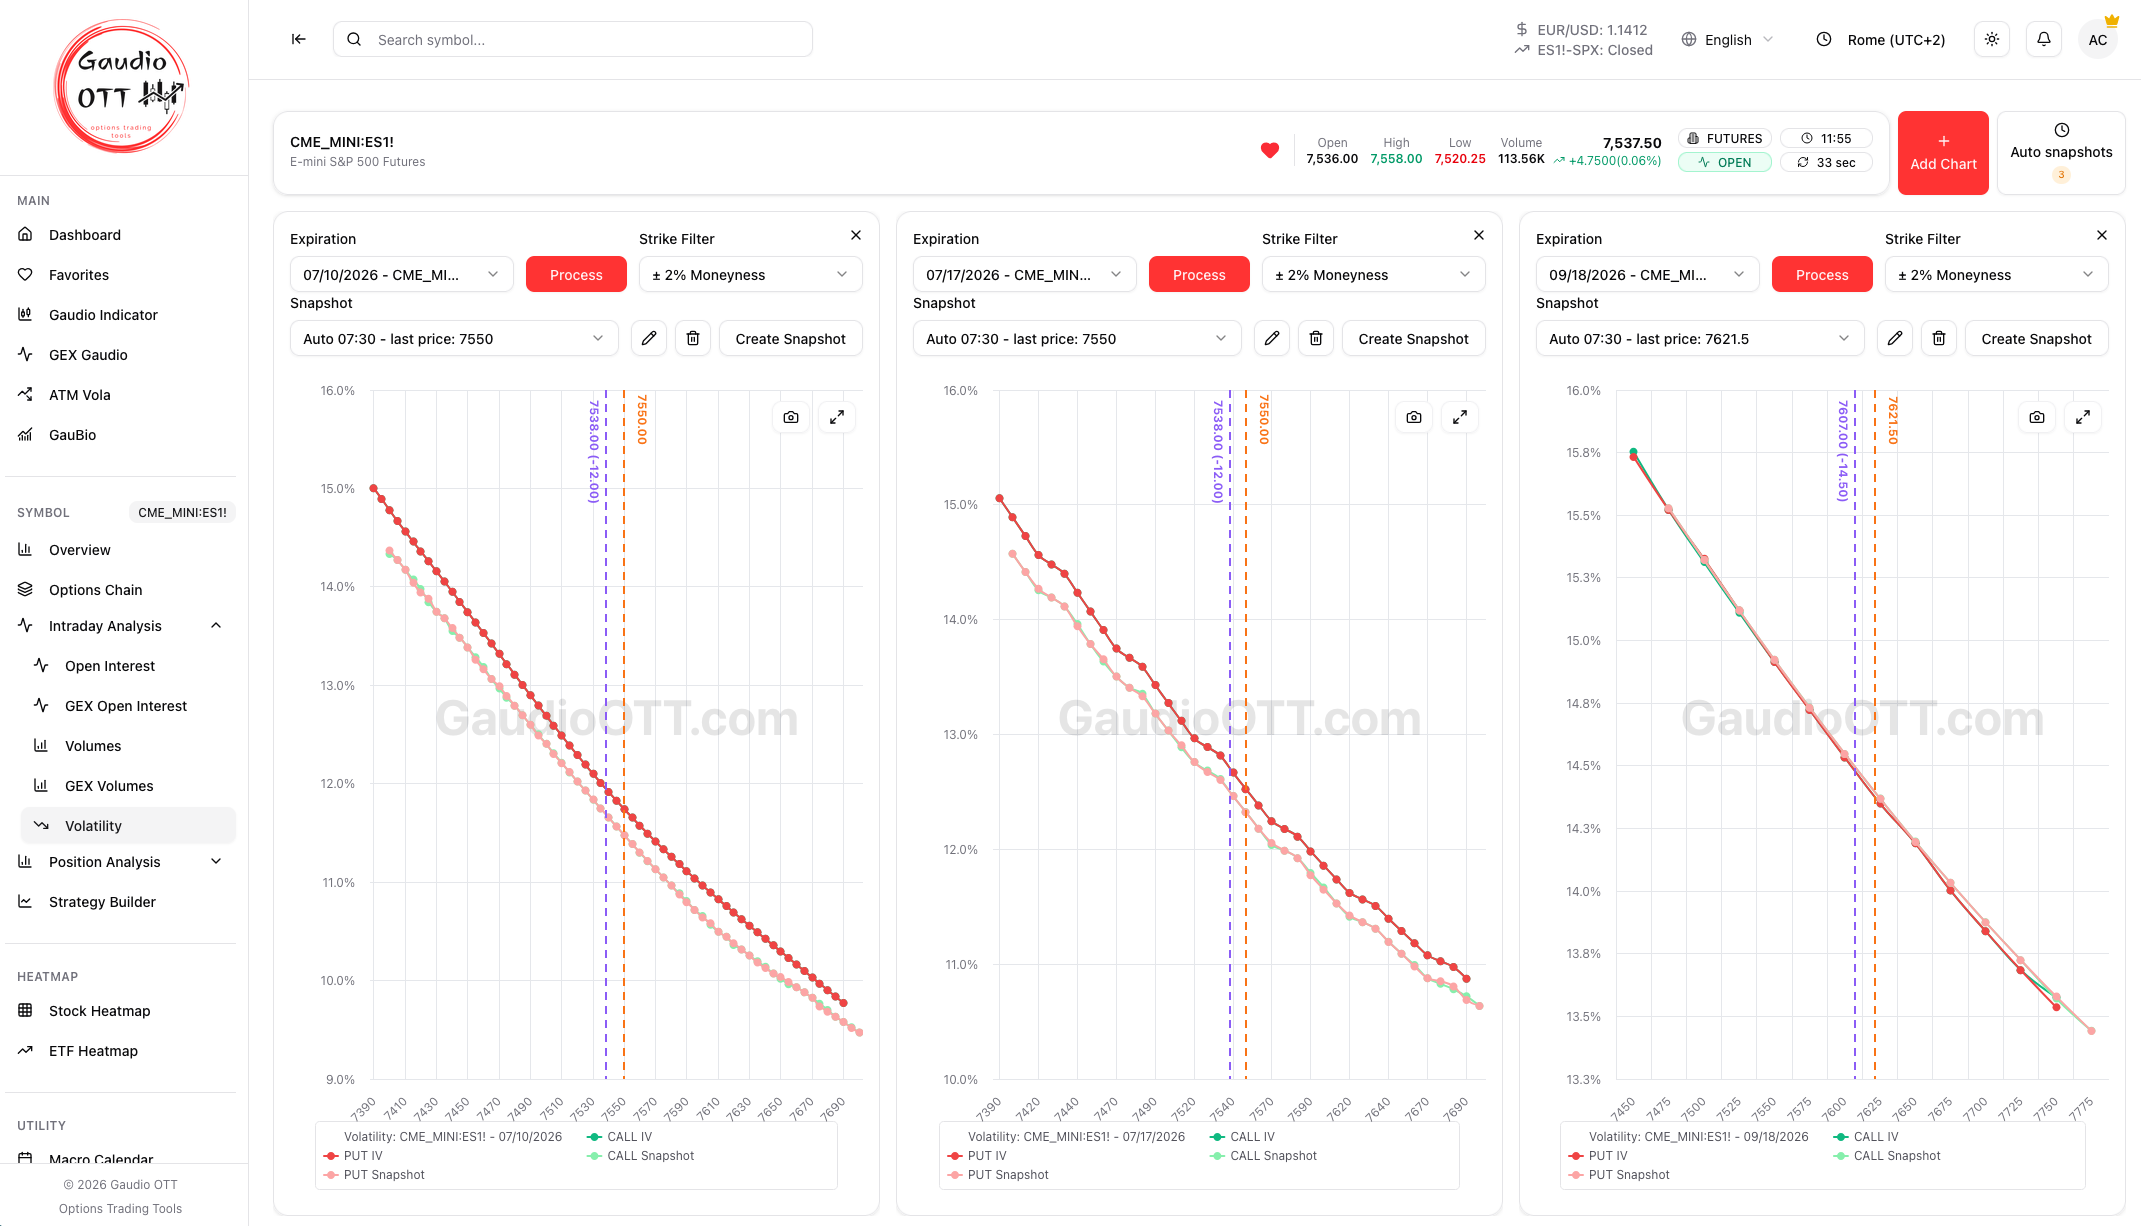
The volatility section: multiple per-expiration charts and the Automatic snapshots panel.
Adding and managing charts
Section titled “Adding and managing charts”With the “Add Chart” button you insert a new volatility chart. For each chart you choose the expiration from the dropdown and press “Process”: the chart loads with the skew of that expiration.
You can keep several charts open at the same time (up to 6 per symbol) to compare different expirations at a glance.
Strike filter
Section titled “Strike filter”Each chart has a Strike filter (Moneyness): choose one of the preset ranges (from ±1% to ±50%) or set a custom min/max to focus the chart on the strikes you care about.
Automatic snapshots
Section titled “Automatic snapshots”The “Automatic snapshots” panel saves the state of your charts automatically at preset times, without you being at the screen:
- You can set up to 3 times per day (Monday to Friday), expressed in your configured timezone.
- At each time, one snapshot is saved for every expiration present in the page.
- Automatic snapshots are kept for 7 days.
To configure them: open the panel, use “Add time” to insert the times you want, and confirm with “Save times”. From that moment snapshots are generated automatically at the set times.
How to use it
Section titled “How to use it”Set snapshot times around the key moments of the session (open, midday, close): reopening the page brings back the picture of volatility at those moments, and you can compare how the skew changed over time.
Related pages
Section titled “Related pages”Ready to use Gaudio OTT?
Section titled “Ready to use Gaudio OTT?”Open your free account and put what you just read into practice.